Tableau Live Workshop.

Rs. 15,000

Batch Ended

Turn your Data into actionable insights & Create intuitive Dashboards & visualizations in Tableau Software!
Start Date
Mar 08, 2023
End Date
Mar 21, 2023
Timing
Weekdays (Evening)
Location
Online
Type
Instructor Led
Duration
15 Hours
training image

Overview

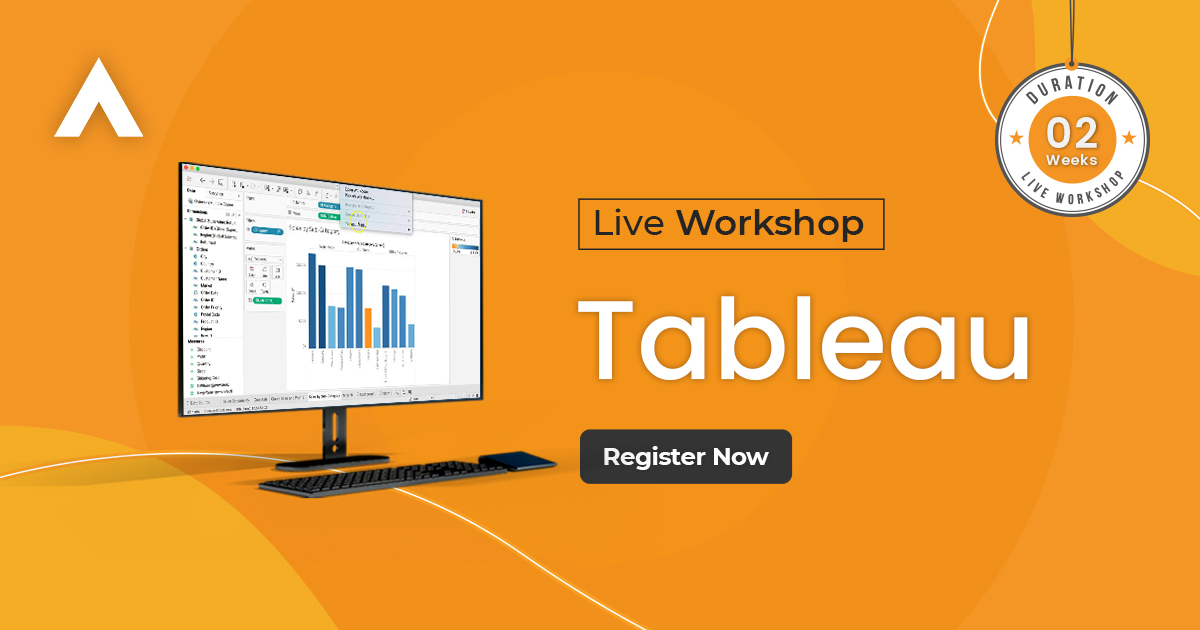
Tableau software is one of the most recognized & demanded Data visualization tools among the other various products in the market. From a simple chart to creative & appealing visualizations; the possibilities are endless & the best part is that it’s for everyone! It even allows Non-technical users to create customized & attractive dashboards.
 
During the 2 weeks of the workshop, you will learn how to use Tableau to create actionable insights of the raw data. You will walk through different advanced techniques of  Tableau.
 
At the end of the workshop, you will have in-depth understanding & hands-on related to Business Intelligence techniques for decision making using Tableau.

Tools Covered

  • Degree Levels: Academy Profession,Associate Degree,Bachelor's,Master,Pre-Bachelor
  • Field of Studies: Computer Sciences,Information Technology,Software Engineering
  • Prior Job Experience: Not Required
  • Other Programs: DWH & BI,Microsoft Power BI,QLIK Hands-on Workshop

  • Recent graduates, third year and final year students from the business management degree
  • Professionals from any domain who want to learn Tableau tool to create effective reports and dashboards and assist Business Analytics department
  • Executives and Department Heads who want to gain a better understanding of Tableau.

  • Understand the fundamentals of Tableau and its functionality
  • Learn how to connect Tableau to various data sources
  • Learn how to create and modify views, charts, and dashboards in Tableau
  • Become familiar with Tableau’s core features and tools
  • Learn how to perform statistical analysis and data manipulation in Tableau
  • Learn how to create custom visualizations and compelling stories with Tableau
  • Learn how to share and publish Tableau dashboards and visualizations
  • Explore best practices and strategies for building effective Tableau visualizations

Meet the Instructor

Mohsin Mahmood

Ed-Tech| Data Analysis | Data Visualization | Data Driven Story Telling| Data Sciences | Machine Learning

Mohsin Mahmood

Ed-Tech| Data Analysis | Data Visualization | Data Driven Story Telling| Data Sciences | Machine Learning


Professional with 12+ years of experience primarily in business analytics, data-driven product/service design and management, performance management, business analysis, data sciences, data visualization, and data-driven storytelling.


Course Outline

  • Tableau introduction & Installation
  • Becoming A Better Data Scientist
  • Connecting Tableau to a Data File – CSV File
  • Navigating Tableau
  • Creating Calculated Fields
  • Adding Colors
  • Adding Labels and Formatting
  • Exporting Your Worksheet
  • Working with Data Extracts in Tableau
  • Working with Time Series
  • Understanding Aggregation, Granularity, and Level of Detail
  • Adding a Filter and Quick Filter
  • Relationships vs Joins
  • Joining Data in Tableau
  • Creating a Map, Working with Hierarchies
  • Creating a Scatter Plot, Applying Filters to Multiple Worksheets
  • Creating First Dashboard!
  • Adding an Interactive Action
  • Understanding how LEFT, RIGHT, INNER, and OUTER
  • Joins Work
  • Joins With Duplicate Values
  • Joining on Multiple Fields
  • Joining Data vs Blending Data in Tableau
  • Data Blending in Tableau
  • Creating Calculated Fields in a Blend
  • Working with Relationships in Tableau

  • Mapping: Setting Geographical Roles
  • Creating Table Calculations
  • Creating Bins and Distributions
  • Leveraging the Power of Parameters
  • Creating a Tree Map Chart
  • Creating a Customer Segmentation Dashboard
  • Advanced Dashboard Interactivity
  • Creating a Storyline
  • Data Interpreter
  • Splitting a Column into Multiple Columns
  • MetaData Grid
  • Fixing Geographical Data Errors in Tableau
  • Custom Territories Via Groups
  • Custom Territories Via Geographic Roles
  • Clustering in Tableau
  • Cross-Database Joins
  • Modeling with Clusters
  • Saving Your Clusters
  • New Design Features
  • Connecting to PDF
  • Connecting to Spatial Files
  • Joining to Spatial Files
  • Step and Jump Line Chart
  • VIZ in Tooltip

Our Methodology

Industry Usecases

With real world projects and immersive content built in partnership with top tier companies, you’ll master the tech skills companies want.

Technical Support

Our knowledgeable mentors guide your learning and are focused on answering your questions, motivating you and keeping you on track.

Career Mentorship

You’ll have access to resume support, portfolio review and optimization to help you advance your career and land a high-paying role.

Testimonials

Frequently Asked Questions

  • This workshop will be a stepping stone in your learning path & help you gain insights & skills to initiate a career in Business Intelligence.

All our Trainings & Workshops are led by Industry Experts so it is made sure that content covered in the courses is designed with hands-on knowledge of more than 80 % along with supporting theory.
Tableau workshop is 90% hands-on & 10% theory.

  • For this professional workshop, you need to have a PC with minimum 4GB RAM and ideally 8GB RAM.

Yes, you will be awarded with a course completion certificate by Dice Analytics. We also keenly conduct an annual convocation for the appreciation and recognition of our students.

Don’t worry! We have got you covered. You shall be shared recorded lectures after each session, in case you want to revise your concepts or miss the lecture due to some personal or professional commitment.

  • You should take this course if want to learn Tableau completely from scratch
  • You should take this course if you know some Tableau skills but want to get better
  • You should take this course if you are good with Tableau and want to take your skills to the next level and truly leverage the full potential of Tableau

Duration: 2 weeks
Class Days: Saturday & Sunday (Weekend)
Timings: 11AM – 4PM

Yes, you can rejoin the training within the span of an year of your registration. Please note following conditions in case you’re rejoining.
1) There are only 5 seats specified for rejoiners in each iteration.
2) These seats will be served on first come first basis.
3) If you have not submitted your complete fee, you may not be able to rejoin. Your registration would be canceled.
So, what's your plan?

Follow the footsteps of thousands of successful alumni...

Batch Completed
svg img
Reserve Seat