

")
In an era where there’s a buzz of terabit communication (PTCL and Nokia) and 5G IoT, data science improves the conventional Quality of Service (QoS), helping telecom companies deliver the promise of digital revolution.
This article explores the top 5 use-cases of data science in telecom industry with a technical angle.
Just a bit more before we start diving into data science applications in telecommunication. It’s pertinent for readers to know the scope of data science. Read about what’s data science here.
Table of Contents
- Real Time Analytics
- Predictive Analytics
- Analytics based Marketing
- Customer Churn Detection
- Fraud Detection
- Data Science Career Path
Data Science Applications in Telecom Sector
The use-cases of data science in the telecommunication industry come in a number of ways.
Generally, telecom companies around the globe utilize Data Science to achieve the following advantages: improve KPIs, reduce revenue loss risks, optimize operations, and set strategies to achieve a competitive advantage in the market.
But how do data scientists make this happen?
We address this as follows:
Real Time Analytics
Trend predictions at the right time spurs telecom companies to form catch-up business strategies and remain competitive in the market.
The data patterns can guide in; making operational decisions or product development and marketing strategies thereby increasing operational efficiency and improving customer experience.
What’s real time analytics?
Also known as real time streaming analytics, it’s a discipline of data analytics that applies logic and mathematics on data to find useful patterns for better and faster decision making.
It has found its applications in business analytics where data streams are continuously ingested into a database or a data warehouse and analytics are performed within minutes or seconds time.
How is it benefiting telecom companies?
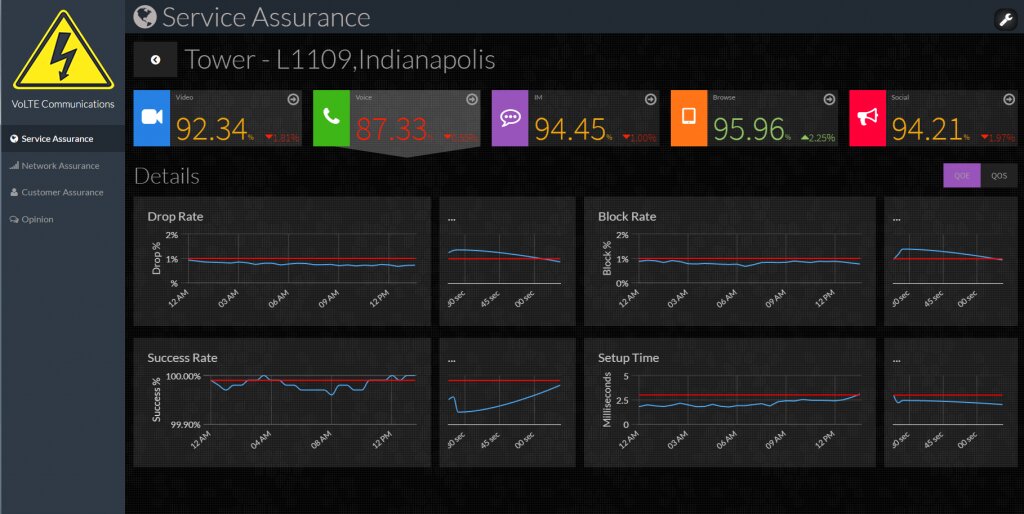
Mobile network operators (MNOs) and other telecom companies use real time analytics to monitor KPIs and Customer Experience (QoE) in up-to-the-minute time as new and updated transactional data arrives at the warehouse.
Real time big data analytics enables the reporting of both historical and current data simultaneously thereby enabling easy trend prediction.
IMPORTANT: It’s to be noted that real time data analytics is different from historical data analytics that too is applied over historical data but in batch processing.
Telecom companies use top real-time data analytics tools such as AWS Kinesis, Azure stream analytics, and Google cloud dataflow.
Such platforms also enable companies to view the performance of competitors simultaneously (if relevant market data is available).
In real time streaming analytics, telecom operators have the flexibility to visualize data and measure performance around a specific business question.
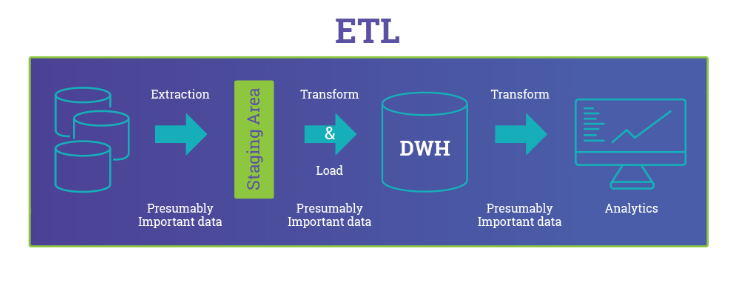
The architecture design for real time analytics is carefully developed to ingest streams of data to undergo normalization before it can be stored. This is to enable efficient and flexible query processing at the later analytics stage.
Learn more about data cleaning and normalization in a comprehensive guide here.
Predictive Analytics

In the telecommunication industry, there’s another discipline of data analytics that’s more powerful in analyzing huge data and achieves better speed comparative to real-time analytics.
Predictive analytics finds its applications in various telecom sub-domains. For example, predictive analytics in network management tackles network traffic prediction, node failure prediction, and radio resource management in 5G. In marketing, predictive analytics offers estimating customer behavior such as customer preferences, and churn.
In a special case, predictive analytics also detects fraud in telecom networks as you will see in detail in a while.
So what’s predictive analytics?
Different from real-time analytics, it’s an advanced analytics discipline that goes beyond using traditional Business Intelligence (BI) tools and incorporates statistical (machine learning) methods for predicting future outcomes. The goal of both disciplines, however, is the same: finding insights to make useful business decisions.
Predictive data analytics builds statistical models to manipulate historical data and find patterns. A futuristic business outcome is then mapped with the pattern to decide the effectiveness of the decision.
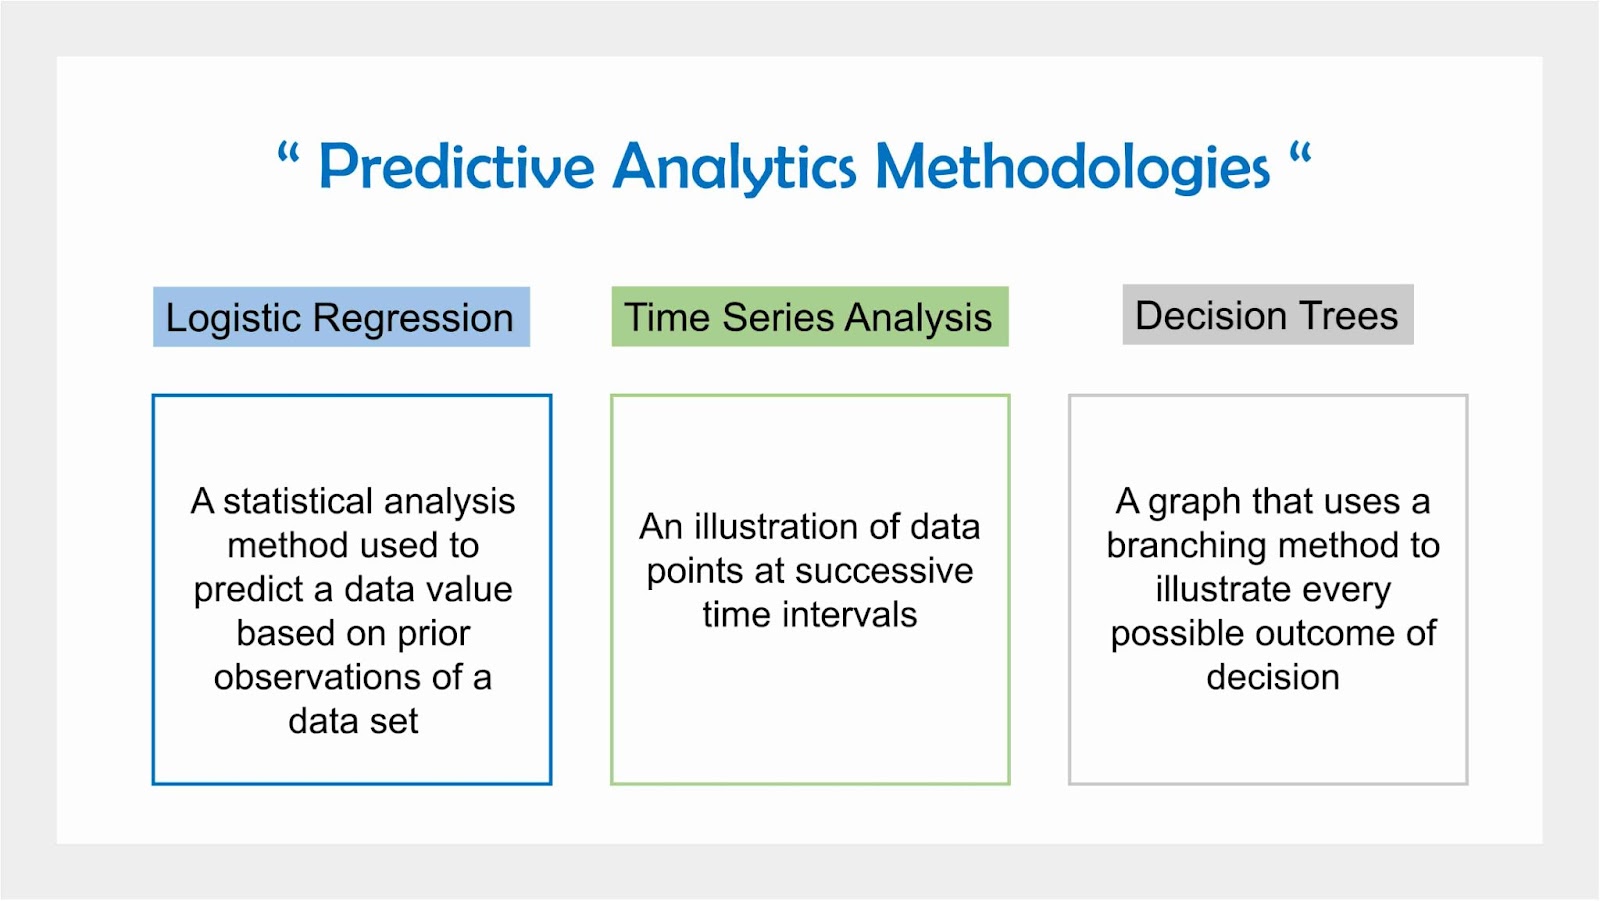
The prevailing modeling techniques predictive analytics are: Logistic regression, time series analysis, and decision trees. The definitions are summarized in the following graphic.
How is it benefiting Telecom companies?
The use-cases of predictive analytics in telecom industry are illustrated as follows:
Analytics based Marketing

In telecommunication, predictive analytics has seen widespread use in designing highly targeted and customized marketing campaigns. Predictive marketing helps businesses to make a profound impact on customer experience (QoE) and avoid customer churn.
Using advanced analytics, marketers incorporate machine learning models to classify customers based on previous records of purchases, product/service preferences, and interaction with the network provider.
This in return offers marketers to determine how a customer segment will respond towards an offer.
How is it useful for telecom companies?
The highly targeted and customized marketing helps marketers to remove doubts, guess work, intuition and inaccuracies that would otherwise come from huge manual work on market data.
Ultimately, precision marketing saves the company a lot of dollars by identifying the most probable outcomes.
Follow more on analytics based marketing in customer churn detection.
Customer Churn Detection
In telecommunication, customer churn rate or customer attrition rate, is the rate at which a company’s customers stop using a subscription. The lower the customer churn, the more the company can retain customers and the better it is for revenue generation.
Reasons for customer churn could vary depending on the quality of telecom service (QoS), targeted marketing, and customer preferences regarding the service.
So, why is it important for Telecom companies to predict customer churn rate?
In a highly saturated and competent market, telecommunication companies need precise targeted marketing content to make its customers stick around. A research by invesp shows that it costs five times more to acquire new customers compared to retaining existing ones.
Moreover, the research pointed out that existing customers are 50 times more likely to try new products and services by company.
Now how to reduce customer churn?
Telecommunication industry places an impressive customer churn prediction method that uses big data technology and AI to dig out reasons for customer churn. This helps the company to bring out targeted marketing campaigns in a short time keeping the ‘risky customers’ engaged for a longer bit.
This machine learning method first picks feature rich big data from telecom data lakes (find out more on data lakes here), which is first pre-processed to achieve accuracy.
This data is then fed to an ML model which classifies it based on churn or non-churn classes. A large dataset of historical churn and loyal customers serves as training data.
Once churn customers are separated out, a clustering algorithm is then used to segment customers based on their characteristics.
Marketers use the information provided by customer segmentation to design catch-up campaigns for each customer segment.
Examples of customer churn in telecommunication is demonstrated by the work. Using logistic regression for classification (churn vs. non-churn), and further segmenting the churn customer class based on k-mean clustering, the probability of churn looks something like this.
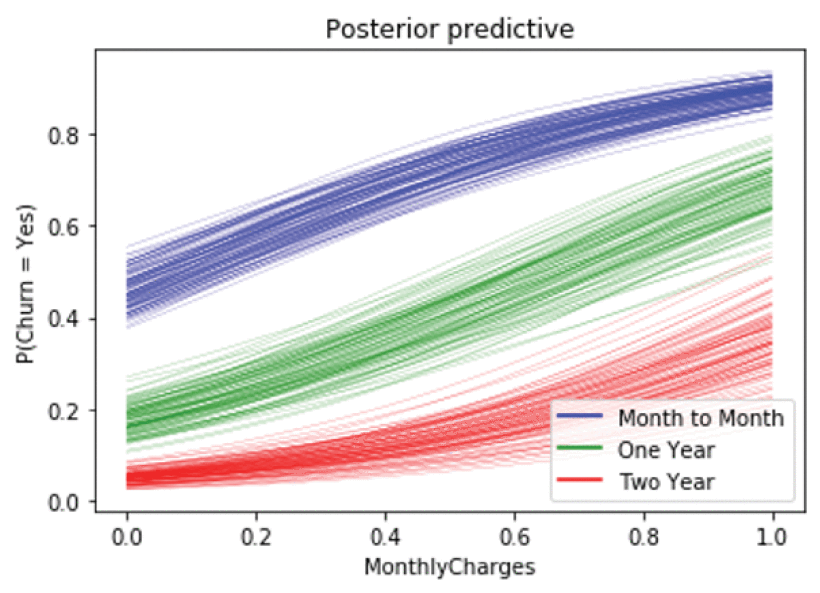
This curve shows that customers subscribing to an expensive offer over a short duration (blue segment) are most likely to churn. At this point, marketers can use their expertise to use the customer’s pain point and offer an equivalent solution.
Fraud Detection

Telecom fraud is the scenario of disguising a phone number and manipulating citizens for economic benefits. The fraud groups and coupon scalpers own large quantities of SIM cards and indulge in illegal business activities.
Telecom fraud detection is a data science powered application that is a specific case of customer behavior analysis. It aims to find an abnormal pattern (anomaly) in customers behavior to spot fraud groups, saving the society from criminal harms.
In a 2021 project, a group of researchers demonstrated using a supervised learning method for outlier detection (abnormal customer behavior) in a Big Data dataset provided by a Chinese ISP. The data is first collected from telecom company’s various operating systems; billing, business operations, and customer relations systems, and stored in a database for normalization.
This data consists of a total 75 features (forming high dimensional data). The data sample is provided as follows;
- User account balance
- International call activation or not
- Avg. call time, call duration
- Times of provincial roaming in past year
- How many mobile phone numbers contacted
- Average days of shutdown in past three months
- Average price of package in past three months
- Average change in package in past three months
A nearest neighbor method is used to detect the customers whose phone number data largely deviates from the rest of the dataset. Such customers are clustered in a group thereby identifying users involved in illegal activities.
Data Science Career Track
To get you started with the Data Science journey, our team at Dice Analytics has set a career path for you to land on a high paying job.
First Step: Data Warehouse and Business Intelligence
Your first step in the Data Science journey starts with the basics of data analytics. This discipline of data analytics tackles data warehouse concepts.
You will learn:
- Hands-on SQL (standard and Teradata specific)
- Using SQL to build ETL pipelines (data collection, transformation, and normalization)
- SDM Layer and Dimensional modeling
- Power BI
- Tableau
With flexible pricing and hybrid learning environment (online/on-site) the course is distributed in a 2-months time frame.
Find more details on the course here!.
Anyone is encouraged to apply for a free consultancy in ‘Reserve Seat‘.
Second Step: Data Science and Advanced Machine Learning
The second step covers advanced data analytics concepts using machine learning.
You will learn:
- Python an exploratory data analysis (EDA)
- Feature engineering
- Probability and Regression
- Predictive Models Accuracy
- Unsupervised Learning/Associate Rules
- PCA and model Deployment
- Industry Project and Presentation
With flexible pricing and hybrid learning environment (online/on-site) the course is distributed in a 2-months time frame.
Find more details on the course here!.
Anyone is encouraged to apply for a free consultancy in ‘Reserve Seat‘.
New: Dice Analytics is an official partner with KNIME. We offer an 8-week course on no code data science here.
Third Step: Marketing Basics
In a business analytics scenario, where you deal with business data and apply data analytics techniques for revenue maximization, foundational knowledge of marketing is very important.
We suggest you two paths here:
First, you take the 2-month introductory course of Business Analytics. It covers all data analytics and marketing concepts in a single course.
OR you take a marketing 101 course online.