


Data engineering forms the pillar of any data-driven business organization. Without it, access to data is slow, and extremely complex. There’s a need for someone who could fish out the most relevant data from a pool of ever increasing data, and optimize it for BI and ML engineers.
In this article we will delve into ‘how data engineers make the fast access to easy and credible data happen’.
IMPORTANT: Please note that all the information mentioned in this article is derived from the source document cited at the end, or otherwise linked internally within the article.
Data engineers build Data pipeline
A data pipeline is a workflow that represents how different data engineering processes and tools work together to enable the transfer of data from a source to a target storage system.
Let’s look at one of the data engineering pipelines that is used in Dice Analytics as part of the training material.
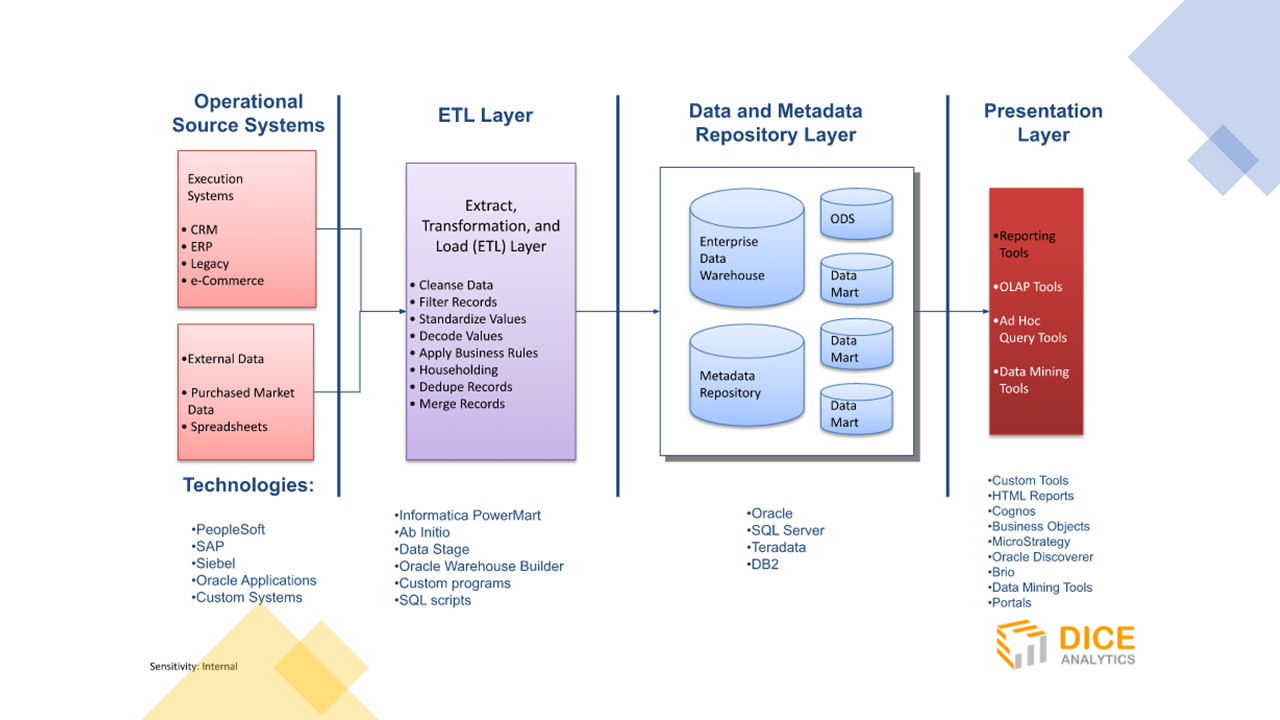
The image represents the components of a data engineering workflow that are the operational source systems, the ETL Layer, the Data repository layer, and the presentation layer. As part of the diagram, relevant technologies are also mentioned in parallel to each layer.
Operational Systems
The operational systems are the Online Transaction Processing (OLTP) systems that process huge transactions of data, by huge number of people, in real-time. They are the user touch points collecting data as the users interact with the systems to avail services of an organization.
A data transaction is a single unit of work that is in the form of a change: insertion, deletion, or multiple query running on the data in a database. In other words, any logical calculation that is done in a consistent mode shall be called as a transaction.
OLTP systems are the sources of business data of all kinds, that is, of customers as well as business processes. It may include for example the Customer Resource Management (CRM) system, Enterprise Resource Planning (ERP) system, Legacy system, and eCommerce system. Information from sources external to the organization are also made part of the workflow and may include data such as the third-party market data, or any form of data that’s helpful to the business.
As part of the technologies, the tools of operational systems are the applications owned by huge companies such as PeopleSoft by Oracle. It might also include custom applications from DevOps capability of the business. These applications help in the management of business services to offer best service delivery to the customers.
ETL Layer
It’s the extract, transform, and load subsystem of the main data engineering pipeline and contains everything between the operational systems and presentation layer. Note, in the image shown above, a separate layer of Data repository is mentioned which shows the storage repository of the ETL process and hence shall not be taken separate to the ETL layer.
Data Engineer extracts data
The Extraction of data is defined as the selection and reading of the data that is most relevant for use in the analysis and reporting. It’s copied to a storage system where the next step of data transformation is applied.
Data Engineer transforms data
At the Transformation stage, most of the data engineering magic happens. These engineering tasks include cleansing the data (correcting misspellings, resolving domain conflicts, dealing with missing elements, parsing unstructured data into structured format, or assigning appropriate data types), combining data from multiple sources, and organizing data to remove anomalies including repetition, insert, delete and update anomaly.
The anomalies are catered as part of the normalization concept of the ETL layer. Normalization is a data structure technique that’s based on the Entity relationship- ER data model. Just to revise some database concepts here, a database is a collection of entities (each represents a table) where an entity exists independent of other entities. Any two entities can be related to each other using foreign keys. The ER data model is used as a tool to design relational databases.
Normalization uses the ER data model to organize huge and complex data from a database in many small, and discrete sets each becoming a relational table. 3NF (3rd normal form) is the data modeling that’s carried out in three stages of normalization. It removes the anomalies and preserves data integrity by omitting dependencies among two attributes (columns in a table) of the data and separates them based on foreign key relationships.
Once data is normalized, it now exists in a robust database structure that occupies optimal storage, and integrity of historical data is maintained against the transactional queries of insert, update and delete as new records from operational systems come.
For large organizations (those with a huge number of diverse data sources and a vast customer base), the ETL process is run within a data warehouse architecture, or otherwise a transactional database might work for small organizations with low workloads. However, it’s always better to invest in technologies that could scale up as an organization grows.
In addition to a data warehouse, a data engineer creates a meta data repository that contains detailed information on the data labels to guide data engineers and business analysts on the contents of the normalized data model. The Data repository layer in the image shows that a data warehouse could also be divided into smaller warehouse portions such as data marts that serve as siloed data sources for many departments of organization to restrict access to unwanted data.
Data engineer loads data
After transformation of data, the Loading stage delivers the data to the presentation layer. This layer is a storage system that is structured based on a different data modeling technique. It’s a denormalized relational data model known as dimensional model. The types of dimensional modeling include star, snowflake, or galaxy schemas.
So why a different data model for the presentation layer?
Well, because of two reasons. First, as the 3NF model divides huge data tables into smaller tables, the model goes to hundreds of tables that are linked with each other forming complex ER diagrams. And so a business user might take a lot of time and effort fetching data to answer a business question. This hinders the goal of data engineers to offer fast and simple access to the data. Thus, 3NF technique is suitable only for maintaining historical data, it’s not a good option for analytical querying.
That’s where dimensional modeling comes handy. It’s the second big step towards data engineering where the model is created centered around a business process. It consists of a fact table (a parent table) that’s linked to many child tables called dimensions. Fact table represents a business process to report on, such as sales, revenue, or employee turnover and is always a numeric value. Dimensions offer more information on its fact and might be either text or numeric. For example, to measure sales of a product in a month, the fact will represent the sales quantity, and price while the dimension might represent month, and customer names.
A data engineer at the Loading stage ensures the delivery of data fit for the dimensional model. This means denormalizing a lot of tables into a single table using join operations and filling out entries of the fact and dimension tables. It’s the final duty of a data engineer to ensure the exact loading as required by the dimensional model.
Up till this point, most of the work is carried out using SQL queries that are written by data engineers. Although this method is cheap however, it’s a rigorous process that takes time writing lengthy SQL scripts to carry out extraction and transformations. While at small scale organizations still employ SQL for data engineering, others use commercial ETL tools such as Informatica and Talend to automate the process.
Presentation Layer
Presentation layer is the area that is directly accessible to the business users and so it shall conform to specific criteria. The DW/BI presentation area is where “data is organized, stored, and made available for direct querying by users, report writers, and other analytical BI applications.”
The dimensional modeling is part of the presentation layer and it’s loaded by the quality conformed data provided by a data engineer in the ETL process. The data is always presented in dimensional models to enhance user understandability and analytical processing.
Finally it’s time to wind up our discussion with final remarks on the presentation layer.While the dimensional model is required to improve performance through using denormalized flattened tables, details of atomic data shall be required to avoid false reporting.
Winding it all up
Data engineering is vastly demanded in the analytics industry and is the cornerstone of data science. Learn the best data engineering skills with Dice Analytics who’s a 5 year old training platform empowering the BI ecosystem of Pakistan.
Dice Analytics is offering a hybrid training facility to support online as well as offline audiences. Learn about our interactive learning approach on Data warehouse and BI training course.