

")
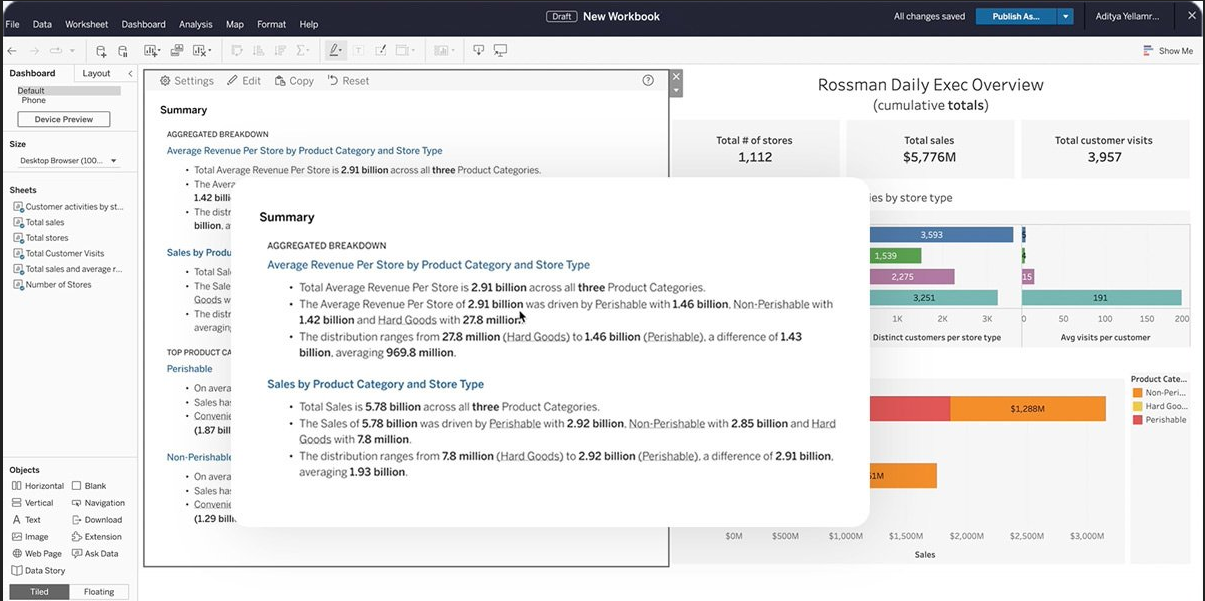
Within organizational context, despite some prominent work in developing easy-to-use tools, understanding analytics remains confined to just a few. Now, Tableau’s new feature, that makes insights more understandable, might be an expedite towards a more data driven organization. Data Stories is an AI-driven tool that explains visual charts and dashboards in an easy, and straightforward way.
‘Data’ has the power to impact every aspect of organizational working. Embedded and augmented analytics are two areas that aim to democratize data within an organization. This means that each individual, irrespective of their technical level, could be empowered to use data for decision making.
Examples of such technologies include: natural language processing- NLP allowing users to type-in natural language to ask queries to programs instead of coding, or AI-driven mobile apps offering automated visuals for employees.
Although these tools remain helpful, employees are still not empowered enough in using analytics in their routine decision making. According to some studies, just 1/4th or 1/3rd of total organizational employees use data in their decision making.
Tableau, a leading body in the Business Intelligence industry, has attempted to break this barrier by developing a new feature that’s powered by AI. The news broke at the recent Tableau Conference 2022 where the upcoming feature: ‘Data Stories’ was announced.
“There is a data revolution going on, and we want to bring data everywhere for everyone.” says Francois Ajenstat, Tableau’s chief product officer.
Data Stories uses an AI algorithm to fetch data from visualizations. These visualizations are pre-developed by the BI engineers and are simply translated into human-understandable language. It’s a quick way to generate key business insights for BI engineers as well as an assistance for employees to learn about what the data analysis says.
Using this capability, employees at any organizational tier can merge the information into their daily strategies and workflows. Data democratization is truly possible if this is enabled.
Tableau seeks to add Data Stories by the end of 2022.
About Tableau
Tableau is a world leading ‘visual analytics platform’ that’s trusted by hundreds of companies globally. It’s available on-cloud, on-premise, and is integratable with Salesforce CRM. The platform hosts stunning visual formats and splendid analytical features. Apart from data visualization capabilities, Tableau uses Einstein Discovery, a proprietary ML feature, that offers automated and intelligent predictions based on your data.
If you want to learn how to use Tableau, the company offers free video training.
To grasp a more comprehensive and interactive training, Dice Analytics has devised ‘live sessions’ on Tableau that offers you with on-the-go query sessions, and robust technical assistance. Trainees can join from anywhere with this two-week online training program.